Debug Windows
This section provides an overview of available Debug Windows in mikroPascal PRO for PIC :
- Breakpoints Window
- Watch Values Window
- RAM Window
- Stopwatch Window
- EEPROM Watch Window
- Code Watch Window
Breakpoints Window
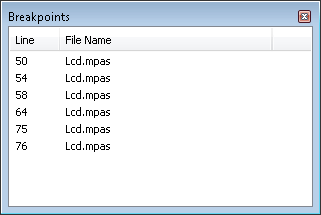
The Breakpoints window manages the list of currently set breakpoints in the project.
Doubleclicking the desired breakpoint will cause cursor to navigate to the corresponding location in the source code.
Watch Values Window
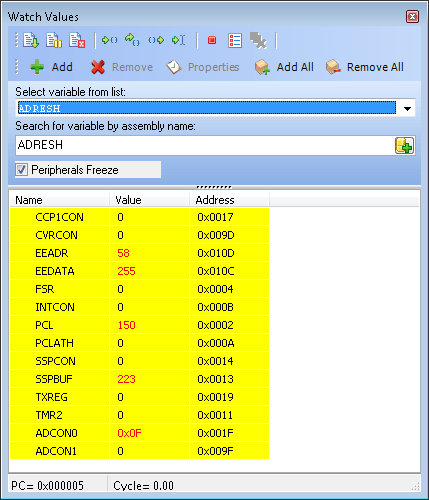
Watch Values Window is the main Debugger window which allows you to monitor program execution. To show the Watch Values Window, select Debug Windows › Watch from the View drop-down menu.
The Watch Values Window displays variables and registers of the MCU, with their addresses and values. Values are updated along with the code execution. Recently changed items are coloured red.
There are two ways to add variable/register into the watch list :
- by its real name (variable's name in program code). Just select wanted variable/register from Select variable from list drop-down menu and click the
 button.
 - by its name ID (assembly variable name). Simply type name ID of the variable/register you want to display into Search for variable by assemby name box and click the
 button.
Also, it is possible to add all variables in the Watch Values Window by clicking  button.
To remove a variable from the Watch Values Window, just select the variable that you want to remove and then click the  button, or press the Delete key.
It is possible to remove all variables from the Watch Values Window by clicking  button.
You can also expand/collapse complex variables i.e. struct type variables, strings, etc, by clicking the appropriate button ( or
or  ) beside variable name.
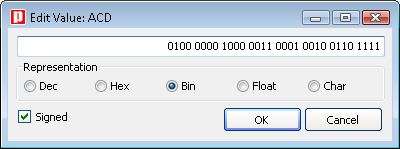
Double clicking a variable or clicking the  button opens the Edit Value window in which you can assign a new value to the selected variable/register. Also, you can choose the format of variable/register representation between decimal, hexadecimal, binary, float or character.
All representations except float are unsigned by default. For signed representation click the check box next to the Signed label.
An item's value can also be changed by double clicking item's value field and typing the new value directly.
RAM Window
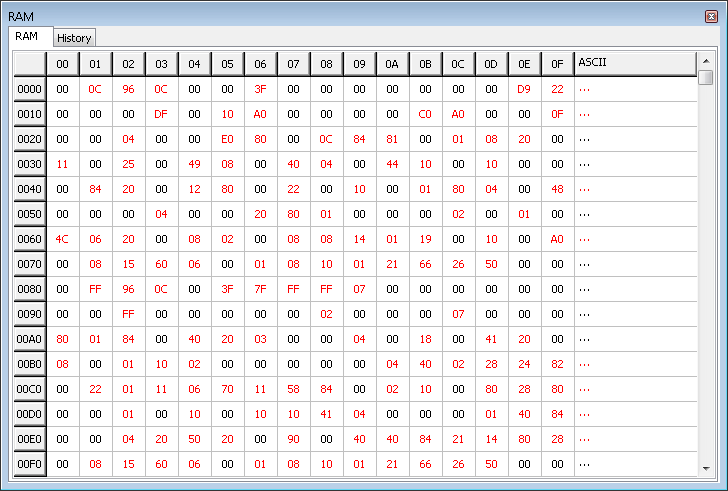
The RAM Window is available from the drop-down menu, View › Debug Windows › RAM.
The RAM Window displays the map of MCU’s RAM, with recently changed items colored red. The user can edit and change the values in the RAM window.
mikroICD Specific : RAM window content will be written to the MCU before the next instruction execution.
Stopwatch Window
The Software Simulator Stopwatch Window is available from the drop-down menu, View › Debug Windows › Stopwatch.
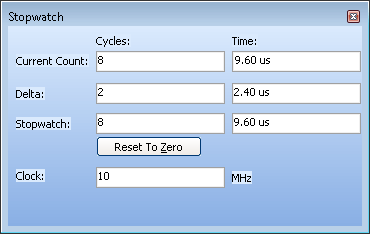
The Stopwatch Window displays a Current Count of cycles/time since the last Software Simulator action.
Stopwatch measures the execution time (number of cycles) from the moment Software Simulator has started and can be reset at any time.
Delta represents the number of cycles between the lines where Software Simulator action has started and ended.
 Notes :
- The user can change the clock in the Stopwatch Window, which will recalculate values for the latest specified frequency.
- Changing the clock in the Stopwatch Window does not affect actual project settings – it only provides a simulation.
- Stopwatch is available only when Software Simulator is selected as a debugger.
EEPROM Watch Window
 Note :
EEPROM Watch Window is available only when mikroICD is selected as a debugger.
To show the EEPROM Watch Window, select Debug Windows › EEPROM from the View drop-down menu.
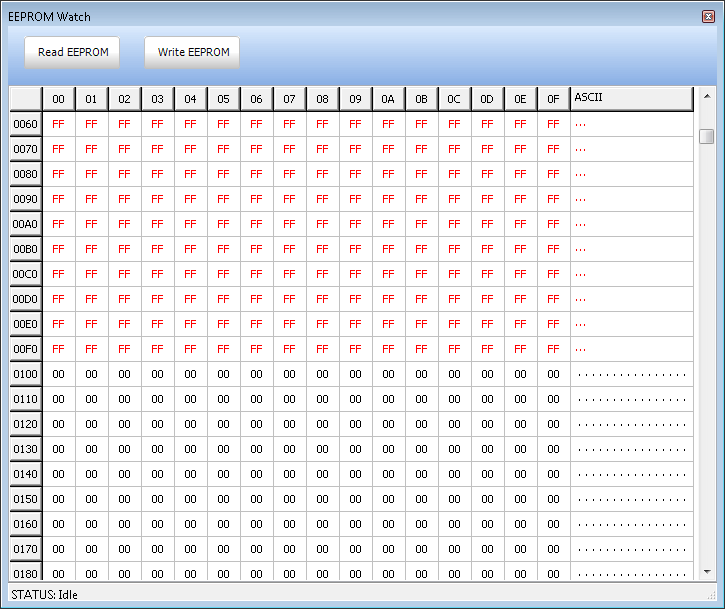
The EEPROM Watch Window shows current content of the MCU's internal EEPROM memory.
There are two action buttons concerning the EEPROM Watch Window :
 - Reads data from MCU's internal EEPROM memory and loads it up into the EEPROM window.
 - Writes data from the EEPROM window into MCU's internal EEPROM memory.
Code Watch Window
 Note :
Code Watch Window is available only when mikroICD is selected as a debugger.
To show the Code Watch Window, select Debug Windows › Code from the View drop-down menu.
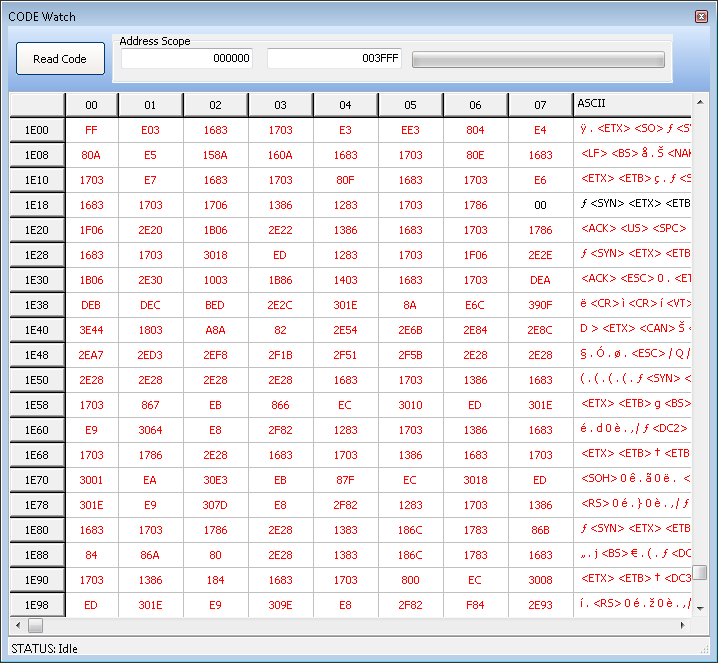
The Code Watch Window shows code (hex format) written into the MCU.
There is one action button concerning the Code Watch Window :
 - Reads code from the MCU and loads it up into the Code Window. Code reading is resources consuming operation so the user should wait until the reading is over.
Also, you can set an address scope in which hex code will be read.
What do you think about this topic ? Send us feedback!


