


mikroICD Debugger Example
Here is a step-by-step mikroICD Debugger Example.

First you have to write a program. We will show how mikroICD works using this example :
program Lcd_Demo;

// LCD module connections
var LCD_RS : sbit at RB4_bit;
var LCD_EN : sbit at RB5_bit;
var LCD_D4 : sbit at RB0_bit;
var LCD_D5 : sbit at RB1_bit;
var LCD_D6 : sbit at RB2_bit;
var LCD_D7 : sbit at RB3_bit;

var LCD_RS_Direction : sbit at TRISB4_bit;
var LCD_EN_Direction : sbit at TRISB5_bit;
var LCD_D4_Direction : sbit at TRISB0_bit;
var LCD_D5_Direction : sbit at TRISB1_bit;
var LCD_D6_Direction : sbit at TRISB2_bit;
var LCD_D7_Direction : sbit at TRISB3_bit;
// End LCD module connections

var text : array[16] of char;
    i : byte;

begin
  PORTB := 0;
  TRISB := 0;
  ANSEL  := 0;
  ANSELH := 0;
  text := 'mikroElektronika';

  Lcd_Init();
  Lcd_Cmd(_LCD_CLEAR);
  Lcd_Cmd(_LCD_CURSOR_OFF);

  for i := 1 to 17 do
    Lcd_Chr(1, i, text[i-1]);
end.

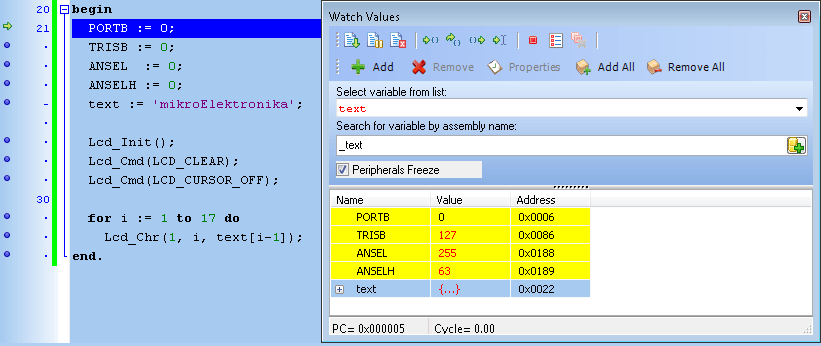
After successful compilation and MCU programming press F9 to start the mikroICD. After the mikroICD initialization a blue active line should appear.
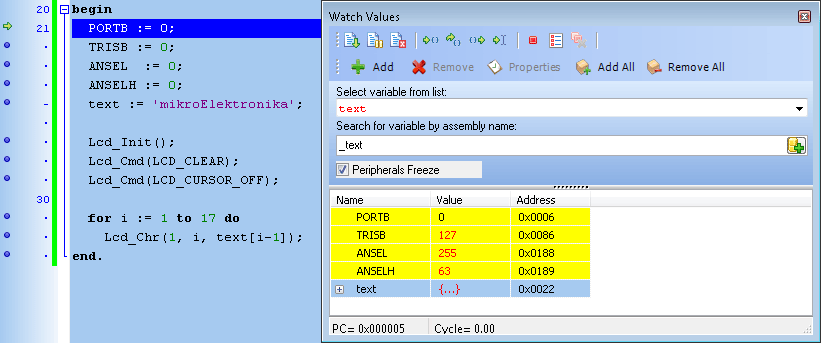

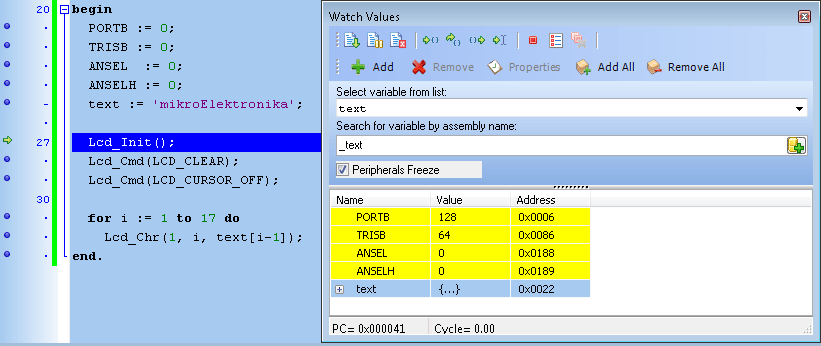
We will debug the program line by line. Pressing [F8] we are executing code line by line.
However, it is not recommended that user does not use Step Into [F7] and Step Over [F8] over Delays
routines and routines containing delays. Instead use Run to cursor [F4] and Breakpoints functions.
All changes are read from MCU and loaded into Watch Window. Note that TRISB changed its value from
255 to 0.

Step Into [F7], Step Over [F8] and Step Out [Ctrl+F8] are mikroICD debugger functions that are used in stepping mode. There is also a Real-Time mode supported by the mikroICD. Functions that are used in the Real-Time mode are Run/Pause Debugger [F6] and Run to cursor [F4]. Pressing F4 executes the code until the program reaches the cursor position line.

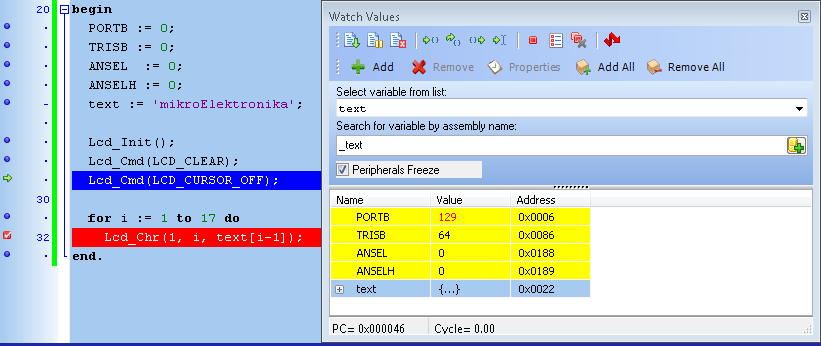
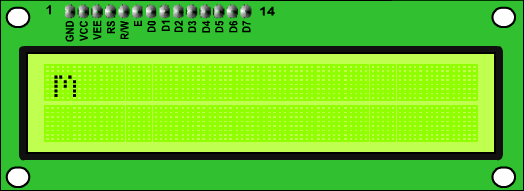
Run(Pause) Debugger [F6] and Toggle Breakpoints [F5] are mikroICD debugger functions that are used in the Real-Time mode. Pressing F5 marks the line selected by the user for breakpoint. F6 executes code until the breakpoint is reached. After reaching the breakpoint Debugger halts. Here in our example we will use breakpoints for writing "mikroElektronika" on Lcd char by char. Breakpoint is set on Lcd_Chr and the program will stop everytime this function is reached. After reaching breakpoint we must press F6 again to continue the program execution.
Breakpoints are divided into two groups: hardware and software breakpoints. The hardware breakpoints are placed in the MCU and they provide fastest debugging. Number of hardware breakpoints is limited (1 for P16 and 1 or 3 or 5 for P18). If all hardware brekpoints are used, then the next breakpoint will be software breakpoint. These breakpoints are placed inside the mikroICD and simulate hardware breakpoints. Software breakpoints are much slower than hardware breakpoints. These differences between hardware and software breakpoints are not visible in the mikroICD software but their different timings are quite notable. That's why it is important to know that there are two types of breakpoints.
The picture below demonstrates step-by-step execution of the code used in above mentioned examples.
 Common Errors :
- Trying to program the MCU while the mikroICD is active.
- Trying to debug Release build version of the program with the mikroICD debugger.
- Trying to debug program code which has been changed, but has not been compiled and programmed into the MCU.
- Trying to select line that is empty for Run to cursor [F4] and Toggle Breakpoints [F5] functions.
- Trying to debug MCU with mikroICD while Watch Dog Timer is enabled.
- Trying to debug MCU with mikroICD while Power Up Timer is enabled.
- Trying to Step Into [F7] the mikroPascal PRO for PIC Library routines. Use Step Over [F8] command for these routines.
- It is not possible to force Code Protect while trying to debug MCU with mikroICD.
- Trying to debug MCU with mikroICD with pull-up resistors set to ON on RB6 and RB7.
What do you think about this topic ? Send us feedback!
Find them on
