Software Simulator Overview
The Source-level Software Simulator is an integral component of the mikroC PRO for 8051 environment. It is designed to simulate operations of the 8051 MCUs and assist the users in debugging C code written for these devices.
After you have successfully compiled your project, you can run the Software Simulator by selecting Run › Start Debugger from the drop-down menu, or by clicking the Start Debugger Icon ![]() from the Debugger Toolbar. Starting the Software Simulator makes more options available: Step Into, Step Over, Step Out, Run to Cursor, etc. Line that is to be executed is color highlighted (blue by default).
from the Debugger Toolbar. Starting the Software Simulator makes more options available: Step Into, Step Over, Step Out, Run to Cursor, etc. Line that is to be executed is color highlighted (blue by default).
Note: The Software Simulator simulates the program flow and execution of instruction lines, but it cannot fully emulate 8051 device behavior, i.e. it doesn’t update timers, interrupt flags, etc.
Breakpoints Window
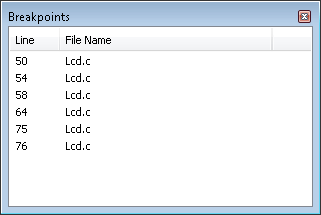
The Breakpoints window manages the list of currently set breakpoints in the project. Doubleclicking the desired breakpoint will cause cursor to navigate to the corresponding location in source code.
Watch Window
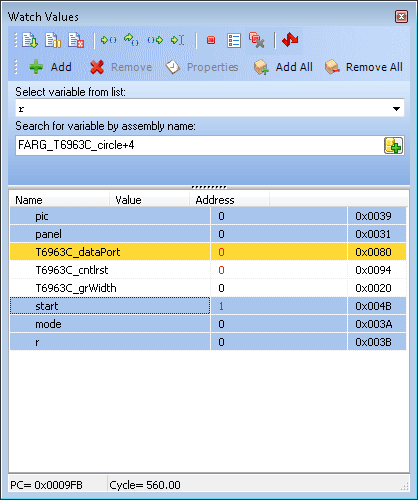
The Software Simulator Watch Window is the main Software Simulator window which allows you to monitor program items while simulating your program. To show the Watch Window, select View › Debug Windows › Watch from the drop-down menu.
The Watch Window displays variables and registers of the MCU, along with their addresses and values.
There are two ways of adding variable/register to the watch list:
- by its real name (variable's name in "C" code). Just select desired variable/register from Select variable from list drop-down menu and click the Add Button
 .
. - by its name ID (assembly variable name). Simply type name ID of the variable/register you want to display into Search the variable by assemby name box and click the Add Button
 .
.
Variables can also be removed from the Watch window, just select the variable that you want to remove
and then click the Remove Button  .
.
Add All Button  adds all variables.
 removes all variables.
You can also expand/collapse complex variables, i.e. struct type variables, strings...
Values are updated as you go through the simulation. Recently changed items are colored red.
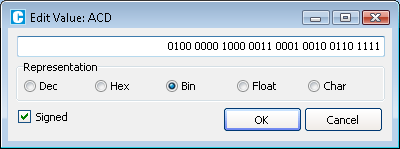
Double clicking a variable or clicking the Properties Button  opens the Edit Value window in which you can assign a new value to the selected variable/register. Also, you can choose the format of variable/register representation between decimal, hexadecimal, binary, float or character.
All representations except float are unsigned by default. For signed representation click the check box next to the Signed label.
An item's value can be also changed by double clicking item's value field and typing the new value directly.
View RAM Window
Debugger View RAM Window is available from the drop-down menu, View › Debug Windows › View RAM.
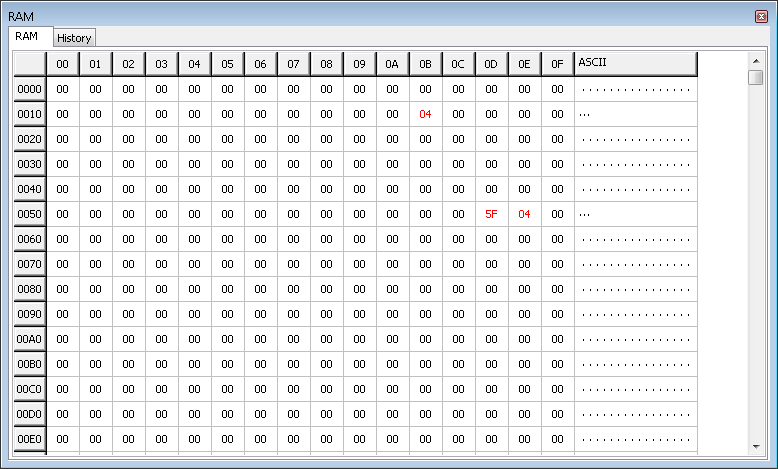
The View RAM Window displays the map of MCU’s RAM, with recently changed items colored red.
Stopwatch Window
The Software Simulator Stopwatch Window is available from the drop-down menu, View › Debug Windows › Stopwatch.
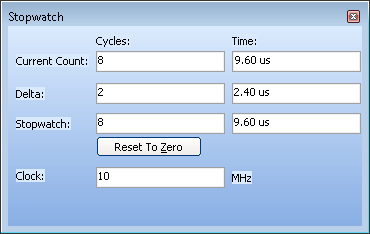
The Stopwatch Window displays a current count of cycles/time since the last Software Simulator action. Stopwatch measures the execution time (number of cycles) from the moment Software Simulator has started and can be reset at any time. Delta represents the number of cycles between the lines where Software Simulator action has started and ended.
Note: The user can change the clock in the Stopwatch Window, which will recalculate values for the latest specified frequency. Changing the clock in the Stopwatch Window does not affect actual project settings – it only provides a simulation.
What do you think about this topic ? Send us feedback!


