Using MPLAB® ICD 2 Debugger
 Important :
- It is assumed that MPLAB® and USB drivers for MPLAB® ICD 2 Debugger are previously installed.
- Procedure described below is also relevant for MPLAB® ICD 3 Debugger.
- Be sure to import compiled
.hexfile prior to importing.coffile, because it contains configuration bit settings which are essential for the proper functioning of the user code.
To successfully use MPLAB® ICD 2 Debugger with generated .cof file, follow the steps below :
- First of all, start mikroBasic PRO for dsPIC30/33 and PIC24 and open the desired project. In this example, UART project for EasydsPIC4A board and dsPIC30F4013 will be opened.
- Open Tools › Options › Output settings, and check the "Generate COFF file" option, and click the OK button.
- After that, compile the project by pressing Ctrl + F9.
- Connect USB cable and turn on power supply on EasydsPIC4A.
- Program the MCU by pressing F11.
- Connect external power supply, USB cable from PC and modular interface cable to the MPLAB® ICD 2 Debugger's appropiate sockets, like on the picture below :
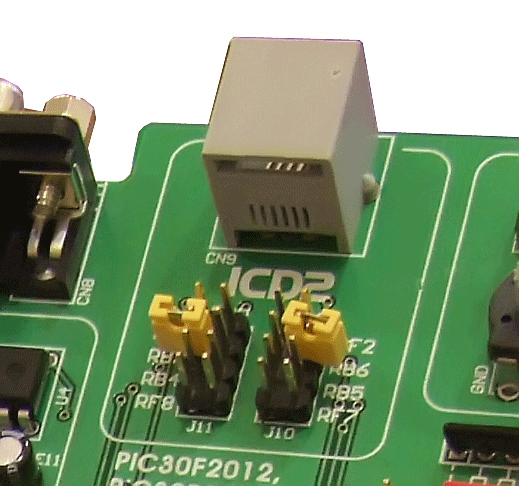
- Connect second end of the modular interface cable to the ICD (RJ12) socket of EasydsPIC4A :
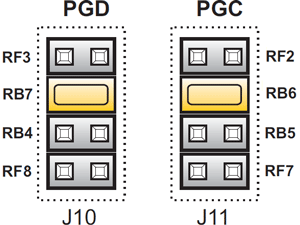
- Put the J11 and J10 Jumpers in the correct position, as showed in the picture below :
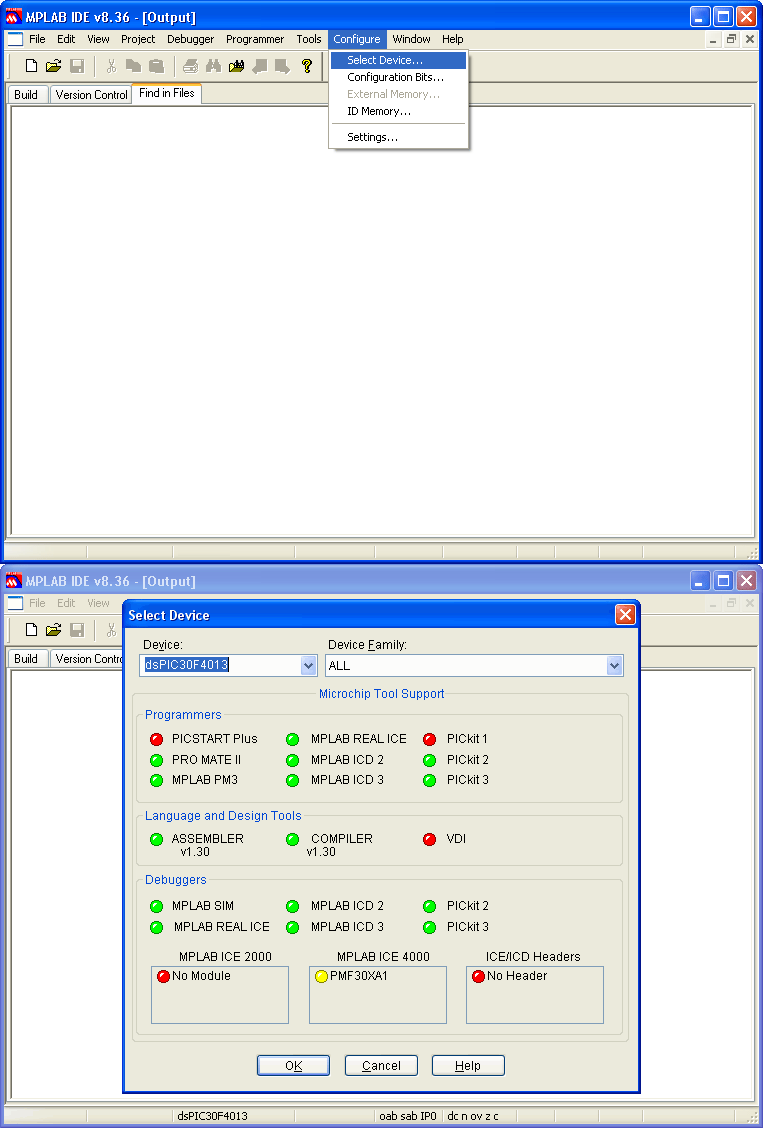
- Next, open MPLAB®, and select the appropriate device by choosing Configure › Select Device... :
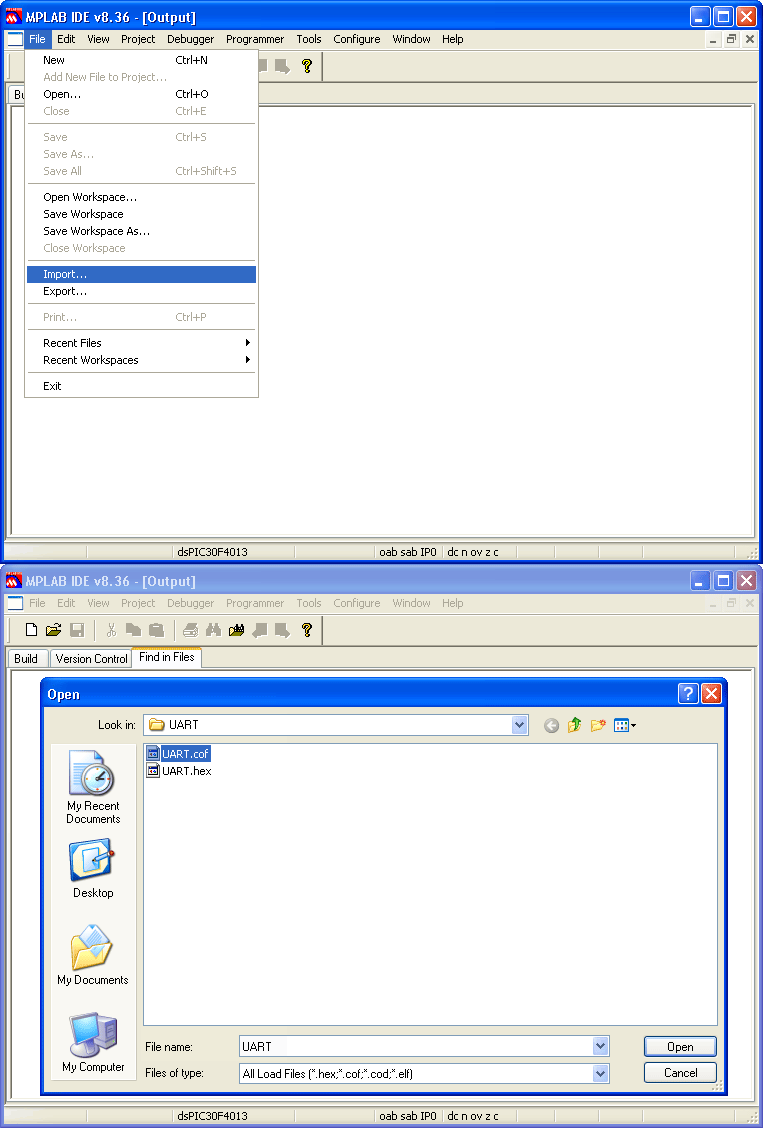
- After device selection, click on the File › Import. Open file dialog box should appear. Then, go to the project folder and open the generated HEX file,
UART.hex. Note :
This is very important, because
 hexfile contains configuration bit settings which are essential for the proper functioning of the user code. - Next, click the File › Import. Open file dialog box should appear. Then, go to the project folder and open the generated COFF file,
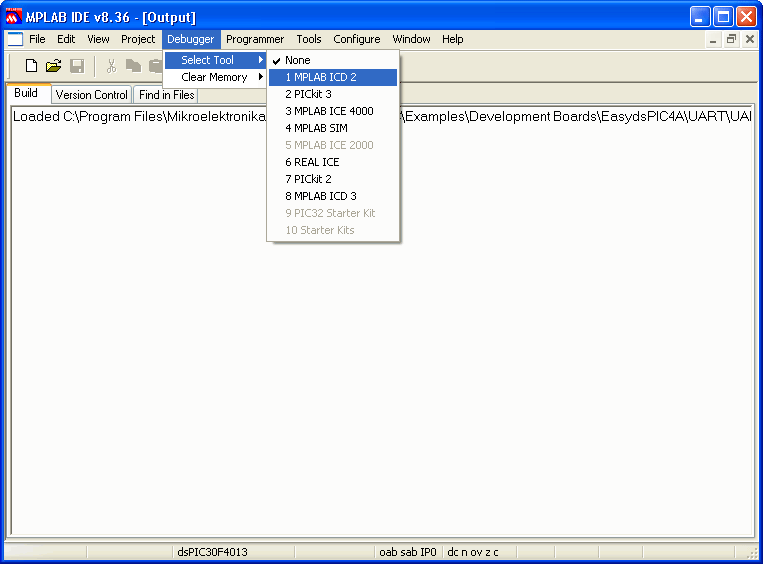
UART.cof: - Then, select the MPLAB® ICD 2 from the Debugger › Select Tool menu for hardware debugging :
- Complete the MPLAB® ICD 2 Setup Wizard from the Debugger menu (if needed).
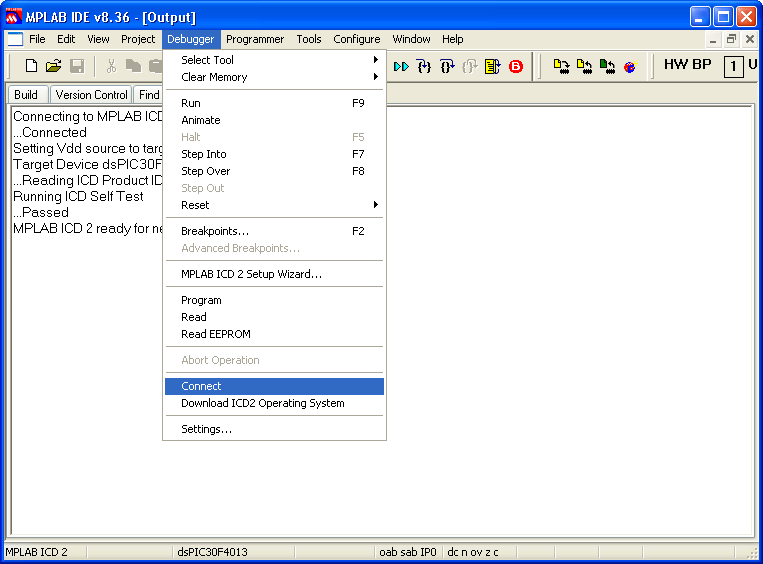
- After completing MPLAB® ICD 2 Setup Wizard, click on the Debugger › Connect :
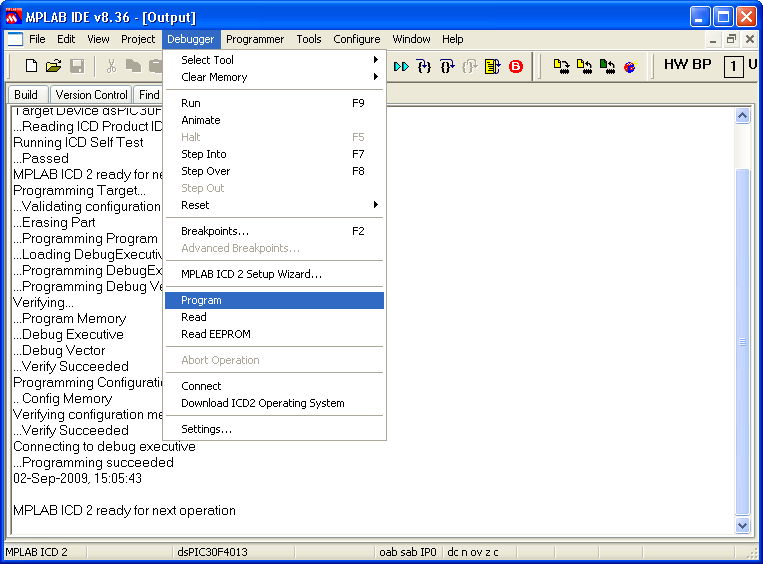
- Finally, click on the Debugger › Program :
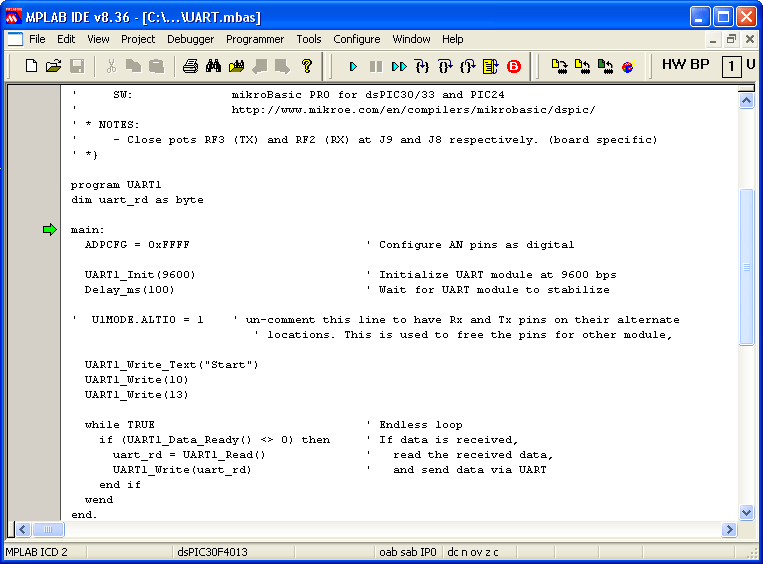
- Now, you can start debugging the code by clicking Step Over button
 on the Debug toolbar, or by pressing F8 :

Copyright (c) 2002-2012 mikroElektronika. All rights reserved.
What do you think about this topic ? Send us feedback!
What do you think about this topic ? Send us feedback!


