


Hardware Debugger Example
Here is a step-by-step Hardware Debugger Example.

First you have to write a program. We will show how the Hardware Debugger works using this example :
// LCD module connections
sbit LCD_RS at GPIO_PORTB_DATA.B2;
sbit LCD_EN at GPIO_PORTB_DATA.B3;
sbit LCD_D4 at GPIO_PORTB_DATA.B4;
sbit LCD_D5 at GPIO_PORTB_DATA.B5;
sbit LCD_D6 at GPIO_PORTB_DATA.B6;
sbit LCD_D7 at GPIO_PORTB_DATA.B7;
sbit LCD_RS_Direction at GPIO_PORTB_DIR.B2;
sbit LCD_EN_Direction at GPIO_PORTB_DIR.B3;
sbit LCD_D4_Direction at GPIO_PORTB_DIR.B4;
sbit LCD_D5_Direction at GPIO_PORTB_DIR.B5;
sbit LCD_D6_Direction at GPIO_PORTB_DIR.B6;
sbit LCD_D7_Direction at GPIO_PORTB_DIR.B7;
// End LCD module connections
char text[] = "mikroElektronika";
char i; // Loop variable
void Move_Delay() { // Function used for text moving
Delay_ms(750); // You can change the moving speed here
}
void main(){
// Only PORTB.B7 is locked by default, unlock it
GPIO_Unlock(_GPIO_COMMIT_PIN_B7);
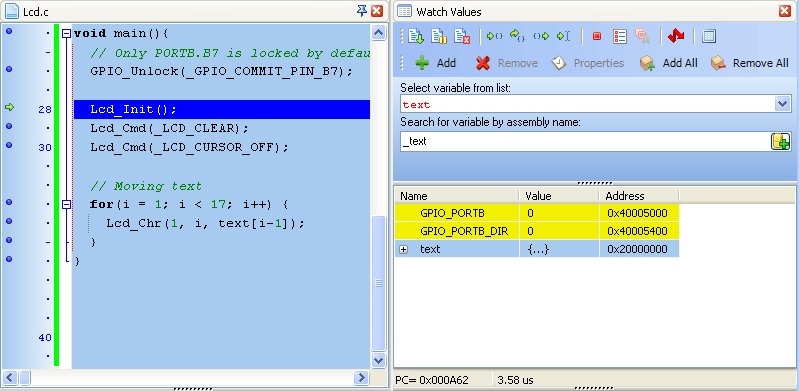
Lcd_Init(); // Initialize LCD
Lcd_Cmd(_LCD_CLEAR); // Clear display
Lcd_Cmd(_LCD_CURSOR_OFF); // Cursor off
// Moving text
for(i = 1; i < 17; i++) {
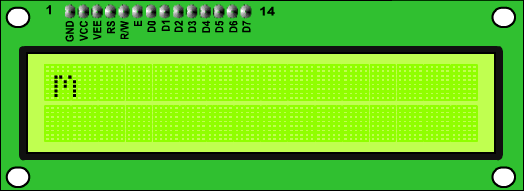
Lcd_Chr(1, i, text[i-1]);
}
}

After successful compilation and MCU programming press F9 to start the Hardware Debugger. After the Hardware Debugger initialization a blue active line should appear.


We will debug the program line by line. To execute code line by line press [F8]. However, it is not recommended to use Step Over [F8] over Delay routines and routines containing delays. In this case use Run to cursor [F4] function or Run [F6] function combined with Breakpoints.

Step Into [F7], Step Over [F8] and Step Out [Ctrl+F8] are Hardware Debugger debugger functions that are used in stepping mode. There is also a Real-Time mode supported by the Hardware Debugger. Functions that are used in the Real-Time mode are Run/Pause Debugger [F6] and Run to cursor [F4]. Pressing F4 executes the code until the program reaches the cursor position line.
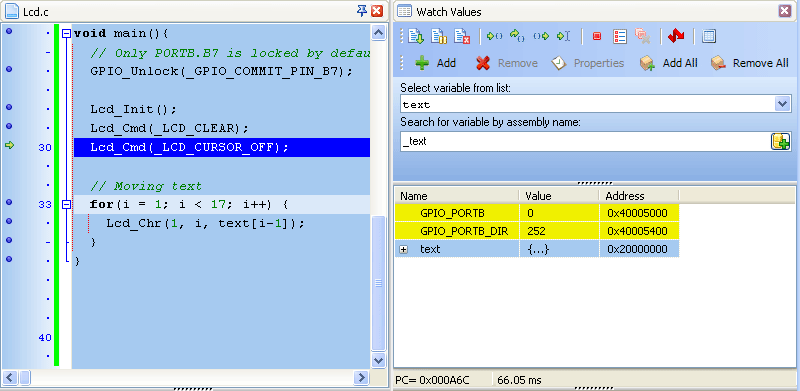

Run(Pause) Debugger [F6] and Toggle Breakpoints [F5] are Hardware Debugger functions that are used in the Real-Time mode. Pressing F5 marks the line selected by the user for breakpoint. F6 executes code until the breakpoint is reached. After reaching the breakpoint Debugger halts. Here in our example we will use breakpoints for writing "mikroElektronika" on Lcd char by char. Breakpoint is set on Lcd_Chr and the program will stop every time this function is reached. After reaching breakpoint we must press F6 again to continue the program execution.

Breakpoints are divided into two groups: hardware and software breakpoints. The hardware breakpoints are placed in the MCU and provide fastest debugging. Number of hardware breakpoints is limited to 8 (6 instruction, 2 data). If all hardware brekpoints are used, then the next breakpoint will be software breakpoint. These breakpoints are placed inside the Hardware Debugger and simulate hardware breakpoints. Software breakpoints are much slower than hardware breakpoints. These differences between hardware and software breakpoints are not visible in the Hardware Debugger software but their different timings are quite notable. That's why it is important to know that there are two types of breakpoints.
The picture below demonstrates step-by-step execution of the code used in above mentioned examples.
What do you think about this topic ? Send us feedback!
Find them on
