Hardware Debugger)
The Hardware Debugger is a highly effective tool for a Real-Time debugging on hardware level. The Hardware debugger enables you to execute the mikroBasic PRO for ARM program on a host ARM microcontroller and view variable values, Special Function Registers (SFR), RAM, CODE and EEPROM memory along with the Hardware Debugger code execution on hardware.

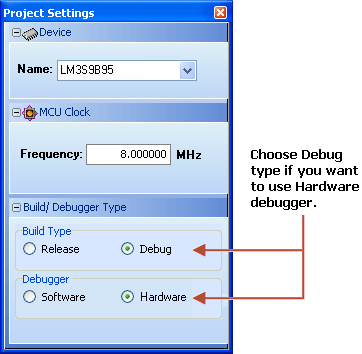
If you have appropriate hardware and software for using the Hardware Debugger select Hardware Debug Build Type before compiling the project.

Now, compile the project by pressing Ctrl + F9, or by pressing Build Icon ![]() on Build Toolbar.
on Build Toolbar.

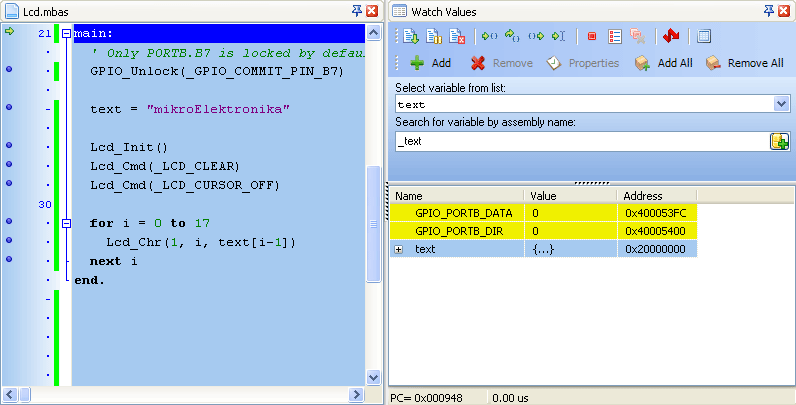
Run the Hardware Debugger by selecting Run › Start Debugger from the drop-down menu or by clicking the Start Debugger Icon ![]() . Starting the Debugger makes more options available: Step Into, Step Over, Run to Cursor, etc. Line that is to be executed is color highlighted (blue by default).
There is also notification about the program execution and it can be found in the Watch Window (yellow status bar).
Note that some functions take more time to execute; execution is indicated with "Running..." message in the Watch Window Status Bar.
. Starting the Debugger makes more options available: Step Into, Step Over, Run to Cursor, etc. Line that is to be executed is color highlighted (blue by default).
There is also notification about the program execution and it can be found in the Watch Window (yellow status bar).
Note that some functions take more time to execute; execution is indicated with "Running..." message in the Watch Window Status Bar.

What do you think about this topic ? Send us feedback!


